
Community Snapshot:
The Community Snapshot Report provides a high-level overview of all current open violations within your community. This report presents the most streamlined and aggregated view of violation data, with options to further filter results by address or street. You can also choose to display only violations with associated fines by selecting the checkbox next to the filtering options.
Navigate to Violations > Reports > Community Snapshot
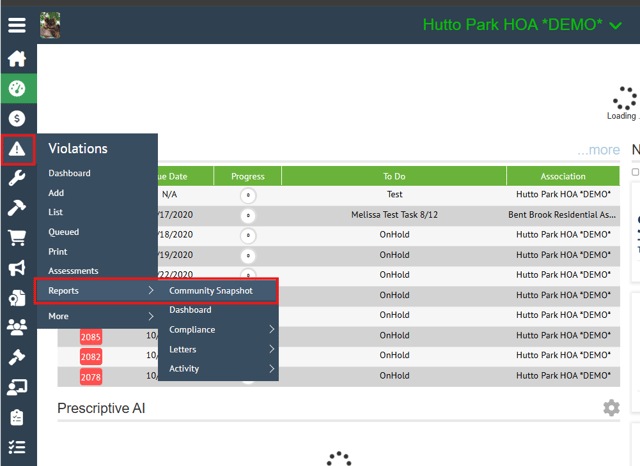
Navi
The report can be exported as either an Excel file or a PDF. Before exporting, you can customize the data included in the report by selecting which columns to display, allowing for a more focused and concise information.
To modify the columns displayed:
- Click the “Show Detail”
In the “Show Detail” window, you can view all data that matches your selected filters. From this screen, you can adjust the number of records displayed using the list size option in the upper-right corner.
To customize the information included in your export:
- Click the gear icon on the right-hand side of the window.
- Select or deselect the columns you would like displayed on your report.
- Click “Apply” to ensure your preferences are saved before running your report.
- Select your preferred method for exporting, PDF file or Excel Spreadsheet.
Your chosen selections will be reflected in the exported Excel or PDF file.
Note: If you’d like to make further modifications to your data, export as an Excel spreadsheet.
Dashboard Report:
The Dashboard Report is similar to the Community Snapshot Report but offers additional filtering options, including date ranges, statuses, and violation stages. While it still provides a high-level overview of your community’s data, it allows for a more detailed and granular analysis.
With the Dashboard Report, you can refine your search criteria to generate more targeted insights and obtain more specific data relevant to your reporting needs.
Using the filter options in the upper-left corner, you can adjust the date range to view data from the previous week, month, up to the last three months, or custom if you need information for a specific period outside of the default options.
The report can be further refined by selecting violation statuses, including Open, Closed, or On Hold. This allows you to focus on the specific records most relevant to your needs. You can also filter results by violation stage and choose which stages to include or exclude from the report. Additionally, you may enable the option to display only violations that have associated fines.
Once you have configured your desired filters, click Run Report to generate the results. The data will be displayed in both pie charts and bar graphs, providing a visual summary of the information.
From there, you can print or export the charts for reporting purposes, these icons will be displayed on the right-hand side of the screen.
Note: This option will be of the general breakout of the report.
For more in-depth breakouts, the Dashboard Report allows you to set custom breakouts for each section.
- Violations (By Category)
- Violations (By Stage)
- Violations (Fee/Fines)
- Violations (By State)
To see a breakdown for each section, Click “Show Detail” which is displayed on the upper-right hand corner of each section. In this window, you have the option to export the chart version of your report as a PDF file or an Excel Spreadsheet.
To customize your fields:
1. Click the gear icon on the right-hand side of the window.
2. Select or deselect the columns you would like displayed on your report.
3. Click “Apply” to ensure your preferences are saved before running your report.
4. Select your preferred method for exporting, PDF file or Excel Spreadsheet.
You can also click the gear icon to customize which columns are displayed in the detailed data view. The report can then be exported as either a PDF or Excel file.
Community Compliance Reports:
The Community Compliance Reports section is divided into five sub-sections, each designed to provide detailed information about violation activity within the community. These reports allow you to analyze compliance data based on your selected filter criteria, helping you identify trends, monitor activity, and review specific violation details.
Each report offers a different perspective on the data, allowing you to choose the option that best meets your reporting and analysis needs.
Community Compliance Report
The Community Compliance Report allows you to access and analyze violation data at the most granular level. This report provides detailed information across your communities, enabling you to drill down into specific records, identify trends, and gain deeper insights into compliance activity based on your selected criteria.
Furthermore, you can click the sections below to filter by date options:
- Associations
- Current Status (Open/Closed/On-Hold)
- Current Stages
- Address Like (By Address/By Street)
- Sort By (Ascending/Descending)
Display Options:
1. This section allows you to choose which violation data fields will be included and displayed in the report.
Limit Results To:
1. This section allows you to modify specific details such as fines, unit statuses, and notes.
You can click the sections below to filter by date options:
- Created Since: Shows all violations whose most recent stage was created.
- Date Range: Shows all violations whose most recent stage was created between the custom dates:
- Exclusive – No Previous Stages (Only show violations that meet the filter criteria)
- Inclusive – Show Previous Stages (Show violations that meet the filter criteria)
Filter options:
Within the Compliance Report, you can apply more targeted filters to customize the data displayed in your report. The filtering options allow you to select or deselect items from the following lists:
- Category/Subcategory List – Filter results based on specific violation categories and subcategories.
- Status List – Include or exclude violations based on their current status.
- Tag List – Refine results using assigned tags to focus on specific types of violations or records.
These filtering tools help you generate a more focused report tailored to your reporting needs.
Once you have selected all the filtering options you’d like displayed on your report, scroll to the bottom of your screen and click “Get Data”.
After running a report, you will see results that reflect all previously selected filters and data breakouts. From this screen, you can export the report as an image, PDF file, or Excel spreadsheet.
Note: This report is dynamic, allowing you to adjust filters at any time. You can modify, add, or remove specific criteria to update the information displayed in your report as needed.
Community Compliance (no fines or CC&Rs)
This report allows you to pull the same data available in the Community Compliance Report. However, violation fine information and CC&R data are not included in the body of this report.
Note: If you select any violation fine or CC&R-related fields, they will not populate in this report. To include violation fine information or CC&R data in your results, you must use the Community Compliance Report instead.
Once you click Get Data and generate the report, all data matching your selected filters will be displayed. Because the report is dynamic, you can add or remove filter criteria at any time, and the results will update automatically in real time without requiring you to rerun the report.
After reviewing the data, you can export the report as an image, PDF, or Excel spreadsheet. This flexibility allows you to save, share, or further analyze the report data in the format that best meets your needs.
Community Compliance Single Line Report
The Community Compliance Single Line Report provides a summarized view of violation activity for a specific address based on the selected filter criteria. This report allows you to quickly review compliance information and identify violations that match your search parameters.
You can search By Address if you want to look up violations for a specific unit, or By Street if you want to view violations for multiple units located on the same street.
If you select Violation Status, an additional sub-filter will appear, allowing you to choose between displaying the violations with the highest priority level OR the violations that have been most recently modified.
You can also choose how the violation information is displayed by selecting either Letter Name or Location:
- Letter Name: Displays the name of the most recent letter issued for the violation.
- Location: Displays the location where the violation occurred.
In the Display Options column, you can select multiple options to customize the report. Please note that if you select Cure Date, the Violation Status option will no longer be available.
Note: After you click Get Data and the report is generated, it will display data based on the filters you selected. Because the report is dynamic, you can modify the filters after the report is generated without needing to rerun the report.
Additional filter options are available based on CC&R Categories/Subcategories. You can choose to select all available options or only the specific categories and subcategories you want included in the report. You can further refine your results by filtering based on Status and Tags.
Once you have selected the desired filters, click Get Data to generate the report and display the results that match your criteria.
Once you click Get Data and generate the report, all data matching your selected filters will be displayed. Because the report is dynamic, you can add or remove filter criteria at any time, and the results will update automatically in real time without requiring you to rerun the report.
After reviewing the data, you can export the report as an image, PDF, or Excel spreadsheet. This flexibility allows you to save, share, or further analyze the report data in the format that best meets your needs.
Compliance Picture Report
The Compliance Picture Report provides detailed violation activity for individual units, including photos associated with each violation. Unlike other compliance reports, this report offers a visual representation of violation details, making it easier to identify, review, and track compliance issues.
The report also includes a variety of filtering options that allow you to narrow down the results and focus on specific units, violation types, statuses, or other criteria relevant to your review.
The Display Options column allows you to select which data fields and filters will be displayed in the report. You can also use these options to further refine your results and limit the report to violations that have photos attached, making it easier to review visually documented compliance issues.
Once you have selected the desired filters, click Get Data to generate the report and display the results that match your criteria.
For this report, you will have the option to export it as an image or PDF file. Exporting to an Excel spreadsheet is not available because the report contains attached photo files.
Community Compliance Sheet Report
The Compliance Sheet Report is meant used to pull reports based on the open/closed status of the violation using your street list as a location filter. You can also further narrow things down by selecting a Created/Closed date or selecting date ranges.
You can further narrow things down by choosing Exclusive or Inclusive:
- Exclusive: Only shows violations that meet the filter criteria.
- Inclusive: Shows violations whose most recent stages meet the filter and date criteria but also display the stages that led up to it.
Once all desired filters have been selected, click Get Data to generate the report. The report will then populate with all records that match the selected filter criteria.
**You can choose to display either Letter Name or Title Name in the report by selecting the appropriate option in the filter settings. This allows you to customize how violation information is presented based on your reporting needs.**
You can click the gear icon to select or deselect the columns you would like to display on your report, then click Apply to save your changes.
For this report, you can export the data as an image, PDF, or Excel spreadsheet.
Note: This report is not dynamic like the other compliance reports. If you need to modify the report criteria, you must update the desired filters and click Get Data again to regenerate the report with the updated results.
End of User Guide
Revised 06/19/26